

Quickbooks Online Tips: What Type of Chart of Accounts and Categories Should a Business Set Up
A properly set up chart of accounts in Quickbooks is the backbone of sound financial accounting infrastructure for a small business. It is important for organizing financial transactions, providing accurate financial reporting, streamlining bookkeeping processes, to make more data-informed business decisions. Don’t just take my word for it, when it comes to managing your finances, the Chart of Accounts acts as the backbone for all your client’s processes and procedures, no matter the industry—but how to set it up varies from business to business.
In this Quickbooks Online accounting tips, blog post will dive into the purpose and function of a chart of accounts and the decision to think about when setting one up. By customizing your chart of accounts to complement your type of business needs and industry standards, you can enhance your financial accounting management and optimize processes. Before we dive in I have questions you should ask yourself
- As a business owner are you struggling with setting their QuickBooks Chart of Accounts?
- Do you have accurate reports in just a few clicks?
- Do you need to reconcile their QuickBooks files?
If you answered “yes” to any of the above questions, then this information can help guide you.
What Is a Chart of Accounts and Why is it Important?
 In a Quickbooks help article, they describe it as “the chart of accounts is a list of all the accounts that QuickBooks uses to track your financial information. You use these accounts to categorize your transactions on everything from sales forms to reports to tax forms. Each account has a transaction history and breaks down how much money you have or owe.”
In Quickbooks, some say it’s “the backbone of a business’s financial reporting.” This organizational tool categorizes every account in the general ledger into useful components like assets, liabilities, equity, revenue, and expenses. By grouping transactions into these accounts, the chart of accounts enables companies to quickly view their overall financial health at a glance. It serves as a roadmap for the complete financial picture of the business.
In this helpful article by Pilot Accounting, they break down the general parts that make up a chart of accounts:
- Account codes/numbers: Unique identifiers assigned to each account for organization purposes. Helpful as your company grows, but can clutter things early on.
- Account titles: specific names indicating the purpose of each account.
- Account categories: Grouping accounts into types like assets, liabilities, equity, revenue, and expenses. Enables grouping of similar accounts.
- Sub-accounts: Further breakdown of specific accounts into more detailed classifications. For example, sub-accounts under revenue could include sales, interest income, etc.
- Account descriptions: Brief explanations providing details on each individual account.
Getting Started Setting Up Chart of Accounts in Quickbooks – What to Consider?
Because the chart of accounts is foundational for good accounting, it’s important to understand it and set it up correctly as well figuring out the nuances and customizations that might relate to your specific business.
The default account type column categorizes transactions into a few main account types, including:
- Assets: a record of purchases for things like vehicles, equipment, buildings, and other assets used for business.
- Liabilities: a record of money you owe but haven’t yet paid like loans, mortgages, and lines of credit.
- Income: transactions and payments related to your normal day-to-day business, such as sales revenue or income for services rendered.
- Expenses: a record of money you spend on expenses related to normal business operations, such as advertising and promotion, office supplies, and rent.
Depending on the size of your company and how it is structured this may play a role when you’re figuring out how simple or complex you want your chart of accounts to be. That is because small businesses, mid-sized companies, and larger corporations will have different requirements based on operational scale and reporting needs.
Meaning variability in the chart of accounts design and the influence of financial reporting requirements are based on:
- Complexity and detail: The size of your business determines the level of detail in your chart of accounts. Small businesses need fewer accounts. Large corporations require more accounts to capture diverse transactions.
- Operational scale: As your business grows, you may need more specific accounts to support decision-making and analysis.
- Reporting requirements: Internal and external reporting needs impact the chart of accounts design. Standardized formats or industry regulations may require specific account types.
- Investor and bank considerations: The chart of accounts should align with investor or lender expectations for detailed financial statements and loan compliance. This enhances transparency.
- Tax compliance: Tax authorities have reporting requirements. Your chart of accounts should facilitate proper tax reporting and compliance by tracking taxable income, deductible expenses, and tax liabilities.
Industry-Specific Accounts and Categories
Coordinating your chart of accounts with your industry’s standards and practices is important for accurate financial reporting and industry benchmarking. For example, there are industry-specific accounts and categories that pertain to verticals such as eCommerce, Software-As-A-Service (Saas), Retail chart of accounts, or a landscaping business for example. Let’s briefly talk about some of these for a moment.
landscaping companies: should set up their income accounts according to the kind of services they offer. If the company only deals with lawn mowing and lawn care, then there should only be one account for lawn services. If the company also installs plants, then consider having a separate income account for installation services. Gita Faust, of FastTrack Consulting, has a helpful article about this type of setup.
Retail stores: a retail store, online or not, is simply a business that sells products. From clothing stores to grocery stores, to sporting goods stores, to hardware stores, and the list goes on. Setup of the income accounts for a retailer is easy since all you need is one income account: Product Sales. If you offer discounts, then you should have a Sales Discount income account as well. Most physical retail stores have similar expenses: rent, utilities, advertising, insurance, employee wages/benefits and computer expenses. However, if you are an online shopping entity, you might not incur these costs. Instead, you might only have to pay website fees, online advertising expenses, and phone bills. The expense accounts you have depends on the manner in which you run your business. Take a moment to think about where most of your money goes, and create your expense accounts accordingly. For example, in retail, a category for product sales might be labeled sales and revenue, whereas inventory purchase might be labeled as cost of goods sold (COGs). For eCom you might have Website Development and Maintenance expenses which could be labeled as operating expenses.
Software tech companies aka SaaS: The default chart of accounts option in Quickbooks is not optimal for Saas startups. The chart of accounts simply represents the list of “accounts” aka categories, you will use to code every transaction. Think, when you receive money from a customer that gets sent to some Revenue (or Deferred Revenue) bucket. When you pay your rent, that goes to a Rent & Utilities account. So maybe you market your solution at industry tradeshows so that might be labeled under a sales and marketing expense category. Or the monthly subscription revenue could be called subscription revenue. Sy you raised VC investment capital and issued stock options to employees then that would be labeled equity. And credit card bills might be labeled under a liabilities category. All SaaS, chart of accounts should have separate accounts to track your larger buckets of spend (e.g., wages, subcontractors, travel, software subscriptions) by each business function (COGS, Sales, Marketing, Product, General & Admin).
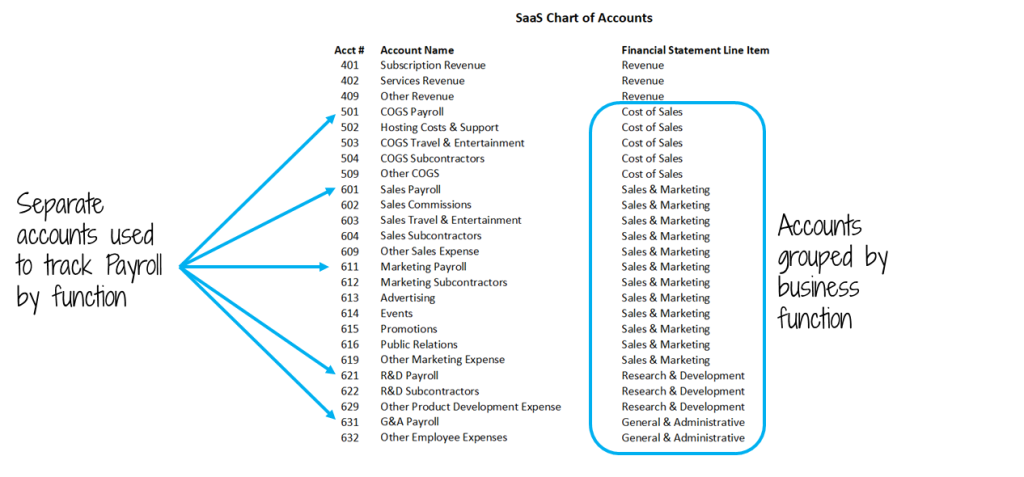
(Image Credit:KPIsense)
These are just a few the Firm of the Future article about industry specific chart of account categories dives into over 31 sectors.
Conclusion
Before creating a chart of accounts, give some thought to what your business actually needs to track. Do you need a super-fine-grained split between seven different types of “Office expenses” or is one category good enough? Are there ways you’d like to slice revenue that will help you analyze the business’s performance? This analysis ensures that your chart of accounts aligns with your business operations and captures all relevant financial information.
Not sure where to begin to get your financial data in line?
Reach out and we will take a look at your chart of accounts and give you our recommendations for free!
Accounting in Quickbooks can be a little confusing if you have any questions and would like a free consultation Huckabee CPA offers Quickbooks accounting services.


