Financial reporting is an important part of managing and operating a successful small business. It provides important information and metrics about your financial performance over time. Unfortunately, many small business owners or startup founders are intimidated by their accounting and choose to hide from it.
Let’s take a closer look at the importance of financial reporting, including key types of financial reports, why financial reporting is important to you and your business, and real-world examples of how you can leverage financial reporting. After all, when it comes to making financial decisions, hard data can help you remain objective. Now many of you may have seen in the news about a crypto exchange called FTX, that is being investigated for financial fraud and lack of proper accounting systems. The new CEO was being questioned by congress recently and he said “they used Quickbooks! A multibillion-dollar company using Quickbooks! Nothing against Quickbooks. A very nice tool, but not for a billion-dollar company.” Whether you use Xero, Freshbooks, or Quickbooks for your small business, they all are fine, the point is you need to have a bookkeeping and accounting system set up properly to track cash flow and other things.
Quickbooks marketing Slack channel must be wildin’ after catching this stray in the FTX congressional hearing:
“They used Quickbooks! A multibillion dollar company using Quickbooks! Nothing against Quickbooks. A very nice tool, but not for a billion dollar company.” pic.twitter.com/aTWZhOa2aH
— Trung Phan (@TrungTPhan) December 13, 2022
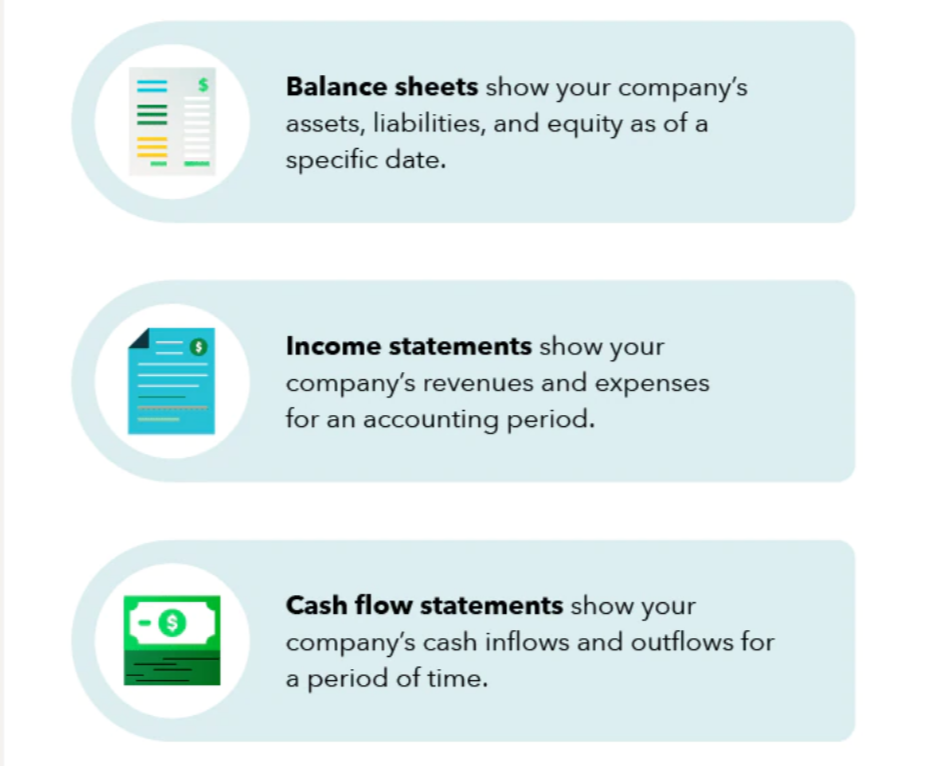
As a startup founder or small business owner, it’s important to understand how to read a Balance Sheet, Income Statement and Statement of cash flows. I have written about this topic a few years ago in an article titled “Business owners guide to reading financial statements like a pro”. In this article, I will try to make it even easier to digest and comprehend what are the key takeaway points of each of the 3 financial reporting documents.
What is financial reporting?
A Quickbooks article by Myranda Mondra states that financial reporting is an objective way to assess a company’s financial health and company financials. In general, financial reporting provides information about your business’s revenue, expenses, profits, cash flow, and profitability.
This type of reporting uses financial statements to disclose financial information to internal and external stakeholders. Business owners may decide to generate financial reports quarterly or annually.
Balance Sheet
A balance sheet is a snapshot of your business at a specific point in time, and
It tells you whether your business is stable and financially healthy:
- Is there cash
- Can you pay your bills
- How much debt do you have
- What is the book value of the business
Balance Sheet Structure
The structure of a balance sheet is:
Assets = Liabilities + Equity
This formula is intuitive when you remember,
A company has to pay for what it owns (assets) by either:
- borrowing money (liabilities), or
- bringing on investors (equity)
Assets are What You Own
Listed top to bottom in order of liquidity, which is how fast they can be converted to cash:
- cash
- inventory (goods available for sale)
- accounts receivable (what people owe you)
- Fixed assets (land, machinery, equipment, and buildings)
Liabilities are What You Owe
Current liabilities are due within 1 year:
- accounts payable
- income tax payable
- current portion of debt
Long-term liabilities are due at any point after that:
- long-term debt
- mortgages payable
Equity is What You’re Worth
If you sold your assets and paid your liabilities, equity’s what’s left over:
- money contributed (common shares)
- profits taken out of the business (dividends)
- earnings retained in the business (retained earnings)
Balance Sheet Analysis
Now that we know how the financial statement is structured, we can talk about how to analyze it.
There are three types of ratios we’ll review on the balance sheet:
- liquidity
- solvency
- profitability
Liquidity Ratios
Liquidity ratios show your ability to turn assets into cash and include:
- cash ratio
- quick ratio
- current ratio
Solvency Ratios
Solvency ratios show your ability to pay off debts and include:
- cash ratio
- quick ratio
- current ratio
- debt to equity
- interest coverage
- essential solvency ratio
Profitability Ratios
Profitability ratios show your ability to generate income from your balance sheet assets and include:
- return on assets
- return on equity
- return on invested capital
- return on capital employed
Cash Ratio
The cash ratio measures your total cash and cash equivalents against your total liabilities.
It is an indicator of your value under a worst-case scenario, such as a bankruptcy or business shutdown.
A larger ratio is better.
Quick Ratio
The quick ratio measures your ability to meet your short-term obligations with your most liquid assets – also called the acid test ratio.
A higher ratio = better liquidity and financial health.
Current Ratio
The current ratio measures your ability to pay short-term obligations or those due within one year, sometimes called the working capital ratio.
A ratio less than one indicates any debts due within one year are greater than your current assets.
Debt to Equity
The debt-to-equity ratio compares total liabilities against total equity, and
It’s used to evaluate how much leverage you’re using in your business.
Less than 1 = safe
Greater than 2 = risky
Debt-to-equity is heavily dependent on the industry.
Future ratios
The following ratios will be reviewed when we look at the income statement:
Solvency:
- interest coverage
- essential solvency ratio
Profitability:
- return on assets
- return on equity
- return on invested capital
- return on capital employed
Income Statement
An income statement focuses on revenues and expenses over a period of time, usually one year, and tells you if you’re profitable.
It provides insight into:
- a company’s operations
- performance relative to peers
- the efficiency of its management
Income Statement Structure
The structure of an income statement is:
Revenue – Expenses + Gains – Losses – Taxes
Revenues are What you Earn
Whether you’re selling goods or services, revenues are what you earn during a period:
- Merchandise
- Revenue from services
- Miscellaneous revenue, such as interest
Revenue Metrics:
The 5 revenue metrics you need to be tracking are:
- Annual recurring revenue
- Customer lifetime value
- Revenue per customer
- Revenue per product
- Revenue growth
Annual Recurring Revenue
Annual recurring revenue is what it sounds like – what is your average annual revenue.
Many Software as a Service (SaaS) companies focus on monthly recurring revenue (MRR), which they’ll annualize for valuation purposes.
Goal – increase it.
Customer Lifetime Value
CLV measures how valuable a customer is to your company over the relationship with them, not just by purchase.
Revenue per customer x transactions per year x the average customer’s lifetime.
It’s cheaper to maintain a customer than acquire one.
Knowing the CLV will allow you to tailor your sales and marketing to new customers, and help you understand how to keep your existing customers.
Ensure your CLV exceeds your customer acquisition costs.
Revenue Per Customer
How much does your average customer spend?
Revenue / # of customers
This measure allows you to drive sales and marketing programs based on a target number of customers to achieve your revenue targets.
Revenue Per Product
If you have multiple SKUs, you need to know your revenue per SKU.
Product revenue / # of product sales.
This will allow you to calculate the profit margin per product, which will determine:
- Products to sell
- Costs to cut
Revenue Growth
Understand how your revenue is growing quarter to quarter and year to year.
If the goal is to scale the business, you should increase your annual revenue.
If you aren’t we need to do a deeper dive into why.
Expenses
Expenses can be broken down into:
Cost of goods sold represents what it costs you to manufacture what you sold.
Operating expenses are the costs required to run the business that are not directly tied to revenue.
Costs of Goods Sold
If you’re a manufacturer or you’re a reseller, your cost of goods sold is:
Opening Inventory
+ Inventory acquired / produced
– Ending inventory
Accounting rules will determine how you calculate CoGS, which we won’t cover.
Knowing the CoGS allows us to calculate Gross Profit, which is:
Sales – Cost of Sales
Gross Margin is:
(Sales – Cost of Sales) / Sales
Gross Margin is the first step in profitability.
The higher the gross profit and gross margin, the better.
Operating Expenses
You can break overhead expenses down into two categories:
Variable Costs
Variable costs move up or down based on a level of activity.
For example, every unit you sell requires a $1 box. If you sell 100 units, it costs $100 and if you sell 5 units, $5.
Fixed Costs
Fixed costs do not fluctuate with levels of activity.
For example, you pay $10,000 per year in rent whether you sell 100 units or you sell 5 units.
Focus on minimizing fixed costs and controlling your variable costs.
Expense Metrics
For operating expenses the 6 metrics you need to focus on are:
- Customer acquisition cost
- Operating profit margin
- Breakeven sales (units)
- Net profit margin
- Cost to service
- EBITDA
Customer Acquisition Cost
Every customer you attract costs money.
The acquisition cost needs to be lower than the customer’s lifetime value to be profitable.
Divide the costs spent to acquire a customer by the number of customers acquired in a period.
Lower this quickly.
Cost to Service
Once you acquire a customer (customer acquisition cost), you still need to service that customer:
- overhead costs
- direct business costs
You need to understand how your costs are consumed throughout the supply chain.
Lower your cost to service.
Breakeven Sales (Units)
Your break-even sales (units) show you how much you need to sell to cover fixed and variable costs.
Knowing your variable cost per unit and your fixed costs, you can calculate it as:
Total fixed costs / variable costs per unit
The lower the better.
Operating profit margin
Track the profit you’re generating on each dollar of revenue, excluding taxes and interest.
The operating profit margin divides your operating profit by your revenue.
You want our operating profit to be as high as possible.
Net Profit Margin
Net profit and net profit margin allow you to analyze your bottom line and increase profitability.
Net profit is your revenue – less costs of goods sold – less operating expenses, overhead costs and taxes.
The net profit margin divides net profit by revenue.
EBITDA
Eearnings before interest, taxes, depreciation and amortization (EBITDA) measures overall performance, and
it’s often used as an alternative to net income because it excludes the costs to finance the business.
EBITDA is often used to value a business for sale.
Statement of Cashflows
The SCF answers one key question:
Will this business survive.
It tells you how much cash has been received (used) from:
- financing
- operations
- investments
Opening cash + increase or decrease of cash during the period = ending cash
Cash Flow From Operating Activities
Includes sources and uses of cash from your business activities.
It reflects how much cash you generate from your products or services, including:
- rent
- cash from sales
- income tax payments
- salary and wage expense
Increase Operating Cash Flows
Methods to increase your cash flow from operating activities are:
- Extend payables
- Collect receivables
- Increase sale prices
- Increase goods sold
- Expand to new markets
- Decrease operating costs
- Add new services or products
Cash Flow From Investing Activities
Includes sources or uses from your company’s investments, including:
- purchase and sale of assets
- loans made to vendors or received from customers
- purchase or sale of machinery, plant, and equipment
Increase Cash From Investing Activities
To increase your cash from investing activities, consider:
- Sell fixed assets
- Lease new equipment
- Sell investment securities
- Reduce new capital spend
Cash Flow From Financing Activities
Cash from financing activities includes cash from investors and banks, as well as shareholders:
- capital raised
- dividends paid
- principal on debt
- principal repayments
Increase Cash From Financing Activities
To increase your cash from financing activities:
- Raise debt
- Issue shares
- Bond issuance
- Cut distributions
- Blend and extend loans
Cash Flow Focus
You need to understand:
- Is cashflow positive
- Why is it positive or negative
- Are operations strong enough without financing or investments
You want to know whether your company can survive from its operations or whether it’s simply being financed.
Cash Conversion Cycle
The cash conversion cycle shows you how long it takes to convert inventory into cash flows from sales.
CCC = DIO + DSO – DPO
DIO = Days inventory outstanding
DPO = Days payable outstanding
DSO = Days sales outstanding
You want a low CCC.
Days Inventory Outstanding
DIO = Average Inventory / Cost of sales * 365 days
This tells you how long it takes to sell your inventory.
The lower the DIO the faster you’re selling, which should be your goal.
Days Sales Outstanding
Next, focus on how long it takes you to receive actual cash for the goods you sold.
DSO = Average Accounts receivable / Revenue per day
You want to collect money as quickly as possible so a lower DSO is your goal.
Days Payable Outstanding
Your DPO is the amount of time it takes you to pay your suppliers.
In an ideal world, you can extend your DPO so your suppliers fund your sales.
DPO = Average Accounts Payable / Cost of sales per day
Improve Your Cash Conversion Cycle
To improve your cash conversion cycle, you will want to:
- Extend payables
- Collect receivables
- Order inventory just-in-time
- Increase your volume of sales
If you are operating effectively, you should have a low CCC.
Conclusion
While it may sound tedious, or overwhelming, but financial reporting is one of the most important tasks an organization can do. After all, this gives you the capability to make strategic and forward-thinking decisions for you and your business while maintaining compliance with the government. With proper financial forecasting, you’ll be able to take your business to the next level. Have questions? Huckabee CPA has over 30 years of experience helping startups and small to medium-sized companies with financial accounting, reporting and forecasting guidance to that has helped them take their businesses to the next levels. Feel free to contact us for a free consultation.