

The People Productivity KPI Metric: Calculating Revenue Per Employee – How Much Revenue Should Each Worker Generate?
A tight labor market has placed increased wage pressures on employers over the last few years. The result has been a material increase in labor costs for employers looking to backfill vacant positions, retain key personnel, or grow their business with added human resources.
According to an AIHR article, Far too often, organizations focus on financial metrics and return on capital investments instead of truly measuring the contributions made by talented employees. Revenue per employee remains one of the most important but often overlooked business and HR metrics.
This metric is gaining popularity, as corporations are counting on the people they bring on board to be well worth the investment. Revenue per employee has the attention of senior leadership as one of a number of key metrics for SaaS startups. It provides a direct correlation to productivity— measuring how efficient the business is at bringing its product to market. Although it is a lagging indicator of success, its trend and next twelve-month forecast can help support decision-making that fuels your growth appetite and hunger to double down on a plan.
Key Takeaways
- Revenue per employee is an important ratio that roughly measures how much money each employee generates for the company
- To calculate a company’s revenue per employee, divide the company’s total revenue by its current number of employees
- Ideally, a company wants the highest ratio of revenue per employee possible because a higher ratio indicates greater productivity, which often translates to more profits for the company
- For the revenue-per-employee ratio to be useful, it should be used when comparing and analyzing companies in the same industry
- Other factors that can impact the revenue-per-employee ratio include employee turnover and the age of the company
Business entity revenue per business entity employee is a metric that helps to measure the productivity of the labor force and is an important data point used by many organizations to gauge the return on labor investment. To calculate this metric, divide your total annual business entity revenue by the total number of business entity employees. Tracking this metric over time will help you gain insights into how prudent and profitable your previous hiring decisions have been over different fiscal periods. Revenue per employee can be calculated in three ways, but option three is the most indicative of future growth.
- Option 1: Total annual revenue / total employees as at December 31
- Option 2: Total December revenue x 12 / total employees as at December 31
- Option 3: Total December quarter revenue x 4 / total average employees December quarter
 How Revenue per Employee Works?
Investopedia states that “revenue per employee” is a meaningful analytical tool because it measures how efficiently a particular firm utilizes its employees. Ideally, a company wants the highest ratio of revenue per employee possible because a higher ratio indicates greater productivity. Revenue per employee also suggests that a company is using its resources—in this case, its investment in human capital—wisely by developing workers who are very productive. Companies with high revenue-per-employee ratios are often profitable.
Revenue per employee is a ratio that measures the total revenue of an organization divided by its current number of employees. It provides a rough estimate of how much money is generated per employee at an organization.
It’s a helpful metric to use when:
- Comparing revenue per employee year-on-year.
- Comparing revenue per employee to equivalent competitors in the same industry.
Revenue per employee, of course, does not operate in a vacuum, and it’s essential to take into consideration both internal and external factors:
- Employee turnover – Revenue per employee can be affected by an organization’s turnover rate. A volatile turnover rate will reflect directly in the metric ratio, as “current number of employees” is used in the formula.
- Age of the organization – If an organization has recently started up, there will likely be more costs than the revenue generated in the first few years. This will affect the revenue per employee output, and therefore should be interpreted within context. In other words, young companies typically have lower revenue per employee than established companies.
- Industry – An industry has a significant influence on the output of revenue per employee. There is little value to compare across industries, as the factors affecting business performance are different. For example, the fast-food industry is much different from banking, and therefore doing a cross-comparison of revenue per employee ratios would not make sense.
Some people confuse ‘profit per employee and ‘revenue per employee’. There is a distinct difference:
- Revenue measures the total income generated from the sales of goods or services.
- Profit is the income that remains, after all, operating expenses, debts, etc., are taken into account.
Using the revenue per employee ratio requires the appropriate information to be extracted from your organization’s financial statements, so be sure to use the ‘revenue’ total and not profit.
Although the Investopedia article points out that Some analysts use a variation of the revenue per employee ratio. In this ratio, they replace the revenue with net income. A ratio similar to revenue per employee is sales per employee, which is calculated by dividing a company’s annual sales by its total employees.
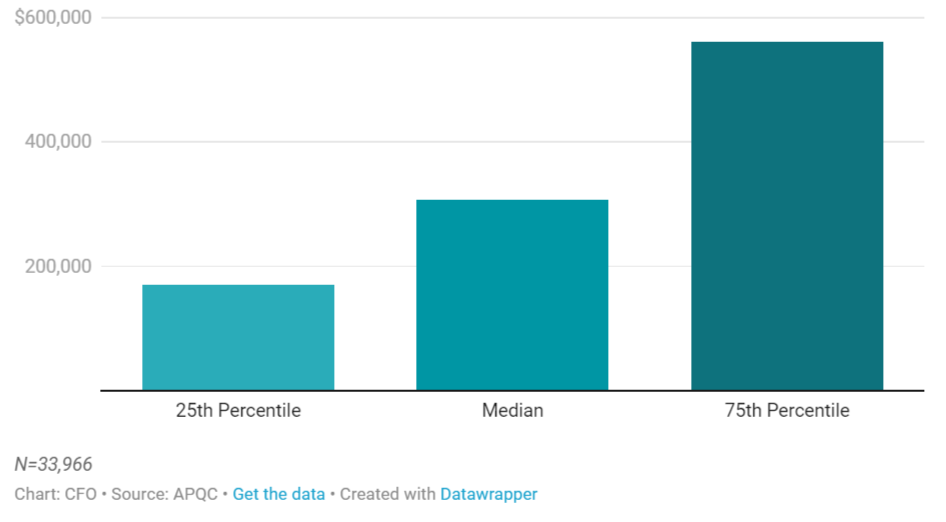
According to data reported in a CFO.com article, Among the 25% of organizations considered to be the best performers on this metric (the 75th percentile in the figure), annual business entity revenue per business entity employee is $561,152 or more. Bottom performers (those in the 25th percentile) generate $171,131 per employee or less. At the median are organizations bringing in $306,849 in revenue per employee each year.
Business Entity Revenue Per Business Entity Employee
Top performers, organizations falling within the 75th percentile, bring in $561,152 or more in revenue per employee each year. Bottom performers generate $171,131 per employee or less.
 According to the U.S. Bureau of Labor Statistics, a median full-time employee’s pay is $1,041 a week, or about $54,281 annually. If you add a 30% benefits load to cover the employer’s share of Social Security and Medicare, unemployment insurance, workers’ compensation coverage, healthcare insurance premiums, and pension costs, the cost of each employee grows to around $70,565 per year.
At a median organization, per the metric above, a median full-time employee would bring the company $236,284, more than three times the amount of his or her pay in annual revenue. In other words, that employee’s job would pay for itself three times over.
There are many factors that could explain a high return of revenue per employee, but ultimately, it means that increases to your organization’s headcount are being added to productive areas of the organization and are leading to revenue increases. Lower revenue per employee may mean that your employee base has become less engaged or productive. In some cases, a lower figure sustained over multiple quarters or years may signal the need for a reduction in headcount.
M&A Deal Metric -Elon Musk Analyzes Twitter’s Revenue Per Employee
The Washington Post recently reported about the potential Elon Musk Twitter acquisition deal In the text exchanges, Musk discussed with a friend how Twitter’s revenue per employee was low when compared with other tech companies, an indication that layoffs could be in store.
The friend, investor Jason Calacanis, wrote: “Back of the envelope. Twitter revenue per employee: $5B/8K employees,” or $625,000 per employee, and compared that number to Apple’s $2.37 million per employee and Google’s $1.9 million. Musk emphasized the text with exclamation points and then added, “Insane potential for improvement.”
In 2019, Netflix was the most effective company, generating over 2.34 million U.S. dollars of revenue per employee. Apple ranked in second place with annual revenue of almost 1.9 million U.S. dollars per employee. Let’s have a look at some well-known tech companies in terms of their revenue per employee.
| Company name | Revenue per employee |
| Apple | $1,899,080 |
| Facebook (Meta) | $1,573,072 |
| Alphabet | $1,361,298 |
| HP | $1,049,214 |
| Microsoft | $873,910 |
Why measure revenue per employee?
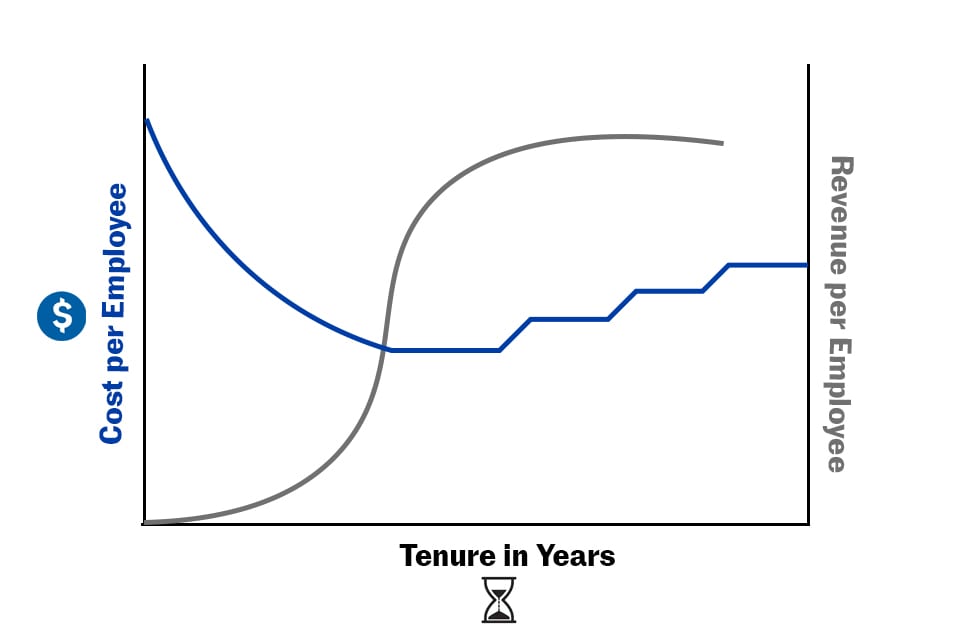
Looking at revenue per employee numbers, in combination with employee costs and tenure, provides visibility into the lifetime value of employees. In addition to the typical high-growth KPIs, a scaling business should understand how its employee productivity, costs and tenure numbers compare to other companies at a similar stage and to itself over time.
A scaling business should be able to answer these three questions at a moment’s notice.
- How much does it cost to find, train and keep an employee in our business?
- How much do employees contribute to our top line?
- How long do employees stay in our company?
Another interesting dimension of revenue per employee is its correlation with employee growth. An article MARS stated that “there is almost a .975 correlation between revenue per employee and employee growth according to Bloom Street Ventures’ review of 77 publicly traded enterprise SaaS companies”.
So you want to improve your revenue per employee—what next?
The first step you should take with this metric is to measure your company’s performance against its own standards. Then, you can compare your company to others within your industry. Revenue can vary quite a bit from one industry to the next, so it’s important to be cautious when comparing your company’s performance to another company in an entirely different industry. For example, comparing your hospital to a university or a professional sports team will not provide you with good decision-making support, you would be much better served comparing yourself to other healthcare organizations.
If you are a startup company trying to scale, you rely on your key people assets to fuel your top-line growth. There are many opportunities during the employee lifecycle to maximize revenue per employee. Here are a few questions to help you identify them.
- Is every additional hire justified in terms of contribution to the top and bottom lines?
- Are you searching and paying for the best quality hire that will make a contribution faster?
- Are your high-performing or potential talent reaching their maximum output? This could be accelerated through mentoring or growth opportunities, for example.
- Do you have the people, processes and tools in place to enable contribution at every stage of the employee lifecycle? For example, do you have sufficient training and one-on-one coaching to ramp up new employees’ productivity as quickly as possible and get beyond their break-even point?
- Are you exiting underperforming talent at an early stage of their employment, even if they’re tenured? It’s important to catch any downward trend early, as it hurts the top and bottom lines, and creates an underperforming culture.
The CFO.com article suggests that benchmarking is key for optimizing productivity and increasing revenue. A good starting point is to identify, measure, and track key performance indicators (KPIs) related to employee productivity. Selecting the right KPIs can help an organization prioritize work, align work with overall organizational strategy, and measure progress toward established targets. KPIs not only help organizations track employee and organizational performance but also identify areas for improvement and help to monitor progress toward short- and long-term goals.
Conclusion
Most annual reports list employees as an expense on their financial statements. However, revenue per employee provides a different story of how to view human capital, the investments made in employees, and the returns. Indeed, the mix of different types of employees at various levels and skill sets is what results in the output of revenue and thus deserves to be measured more precisely.
Another question to ask is “how many more employees do you need to increase your revenue by X%?” Or, on the flip side of that coin, can you keep the same revenue with fewer employees? You will know what impact your new hires are making. This also gives HR a seat at the decision-making table, as financial targets are directly tied to HR initiatives at the start of the year.


