
 Ratio Formula with Examples To Measure Profitability")
How to Calculate Return On Assets (ROA) Ratio Formula with Examples To Measure Profitability
As a business owner, you may invest in resources, such as equipment, manufacturing facilities, machinery, buildings, vehicles, computers, etc, to grow your business. From an accounting perspective, these are tangible and intangible assets, but have you analyzed how efficiently your company utilizes these investments to create profits for the business?
Key Takeaways
- Return on assets, or ROA, is a vital barometer of company profitability.
- ROA measures a company’s aptitude for deploying assets productively to drive earnings growth rather than allowing idle or underutilized capital.
- Companies with a high ROA usually have fewer assets involved in generating their profits.
- While no absolute ROA threshold applies universally, above 5% is generally favorable.
What is Return on Assets (ROA)
Return on assets (ROA) is a financial ratio that investors and business owners can use to measure a company’s profitability to the total asset base. It assesses how efficiently a business utilizes its invested resources – including property, plants, equipment, patents, and more – to generate profit and earnings.
Your return on assets determines how profitable your organization is by comparing net income against your total assets. Specifically, it analyzes net income generated relative to total firm assets reported on the balance sheet.
ROA offers insight into management’s ability to derive value from infrastructure and existing holdings. For investors, ROA indicates how much profit firms realize from existing capital outlays. Strong ROA suggests assets efficiently contribute to the bottom line. Weak ROA prompts review of ineffective capital allocation.
For example, let’s compare two companies: say one business has $2 million in assets. and another has only $200k in assets. And if both generate $100k in profit, the one with fewer assets would be considered more efficient at creating profit since it required less capital investments to reach that goal.
The return on assets ratio varies by industry. One type of industry may have a different ROA range than another. So, suppose an investor is using the ROA formula to analyze a business’s relative profitability to others. In that case, comparing it with similar-sized companies in the same industry makes sense.
According to an article in Business Insider, “Investors often use ROA in deciding whether to put money into a company and evaluate its potential for returns relative to others in the same industry.”
How do you calculate the return on assets ratio formula?
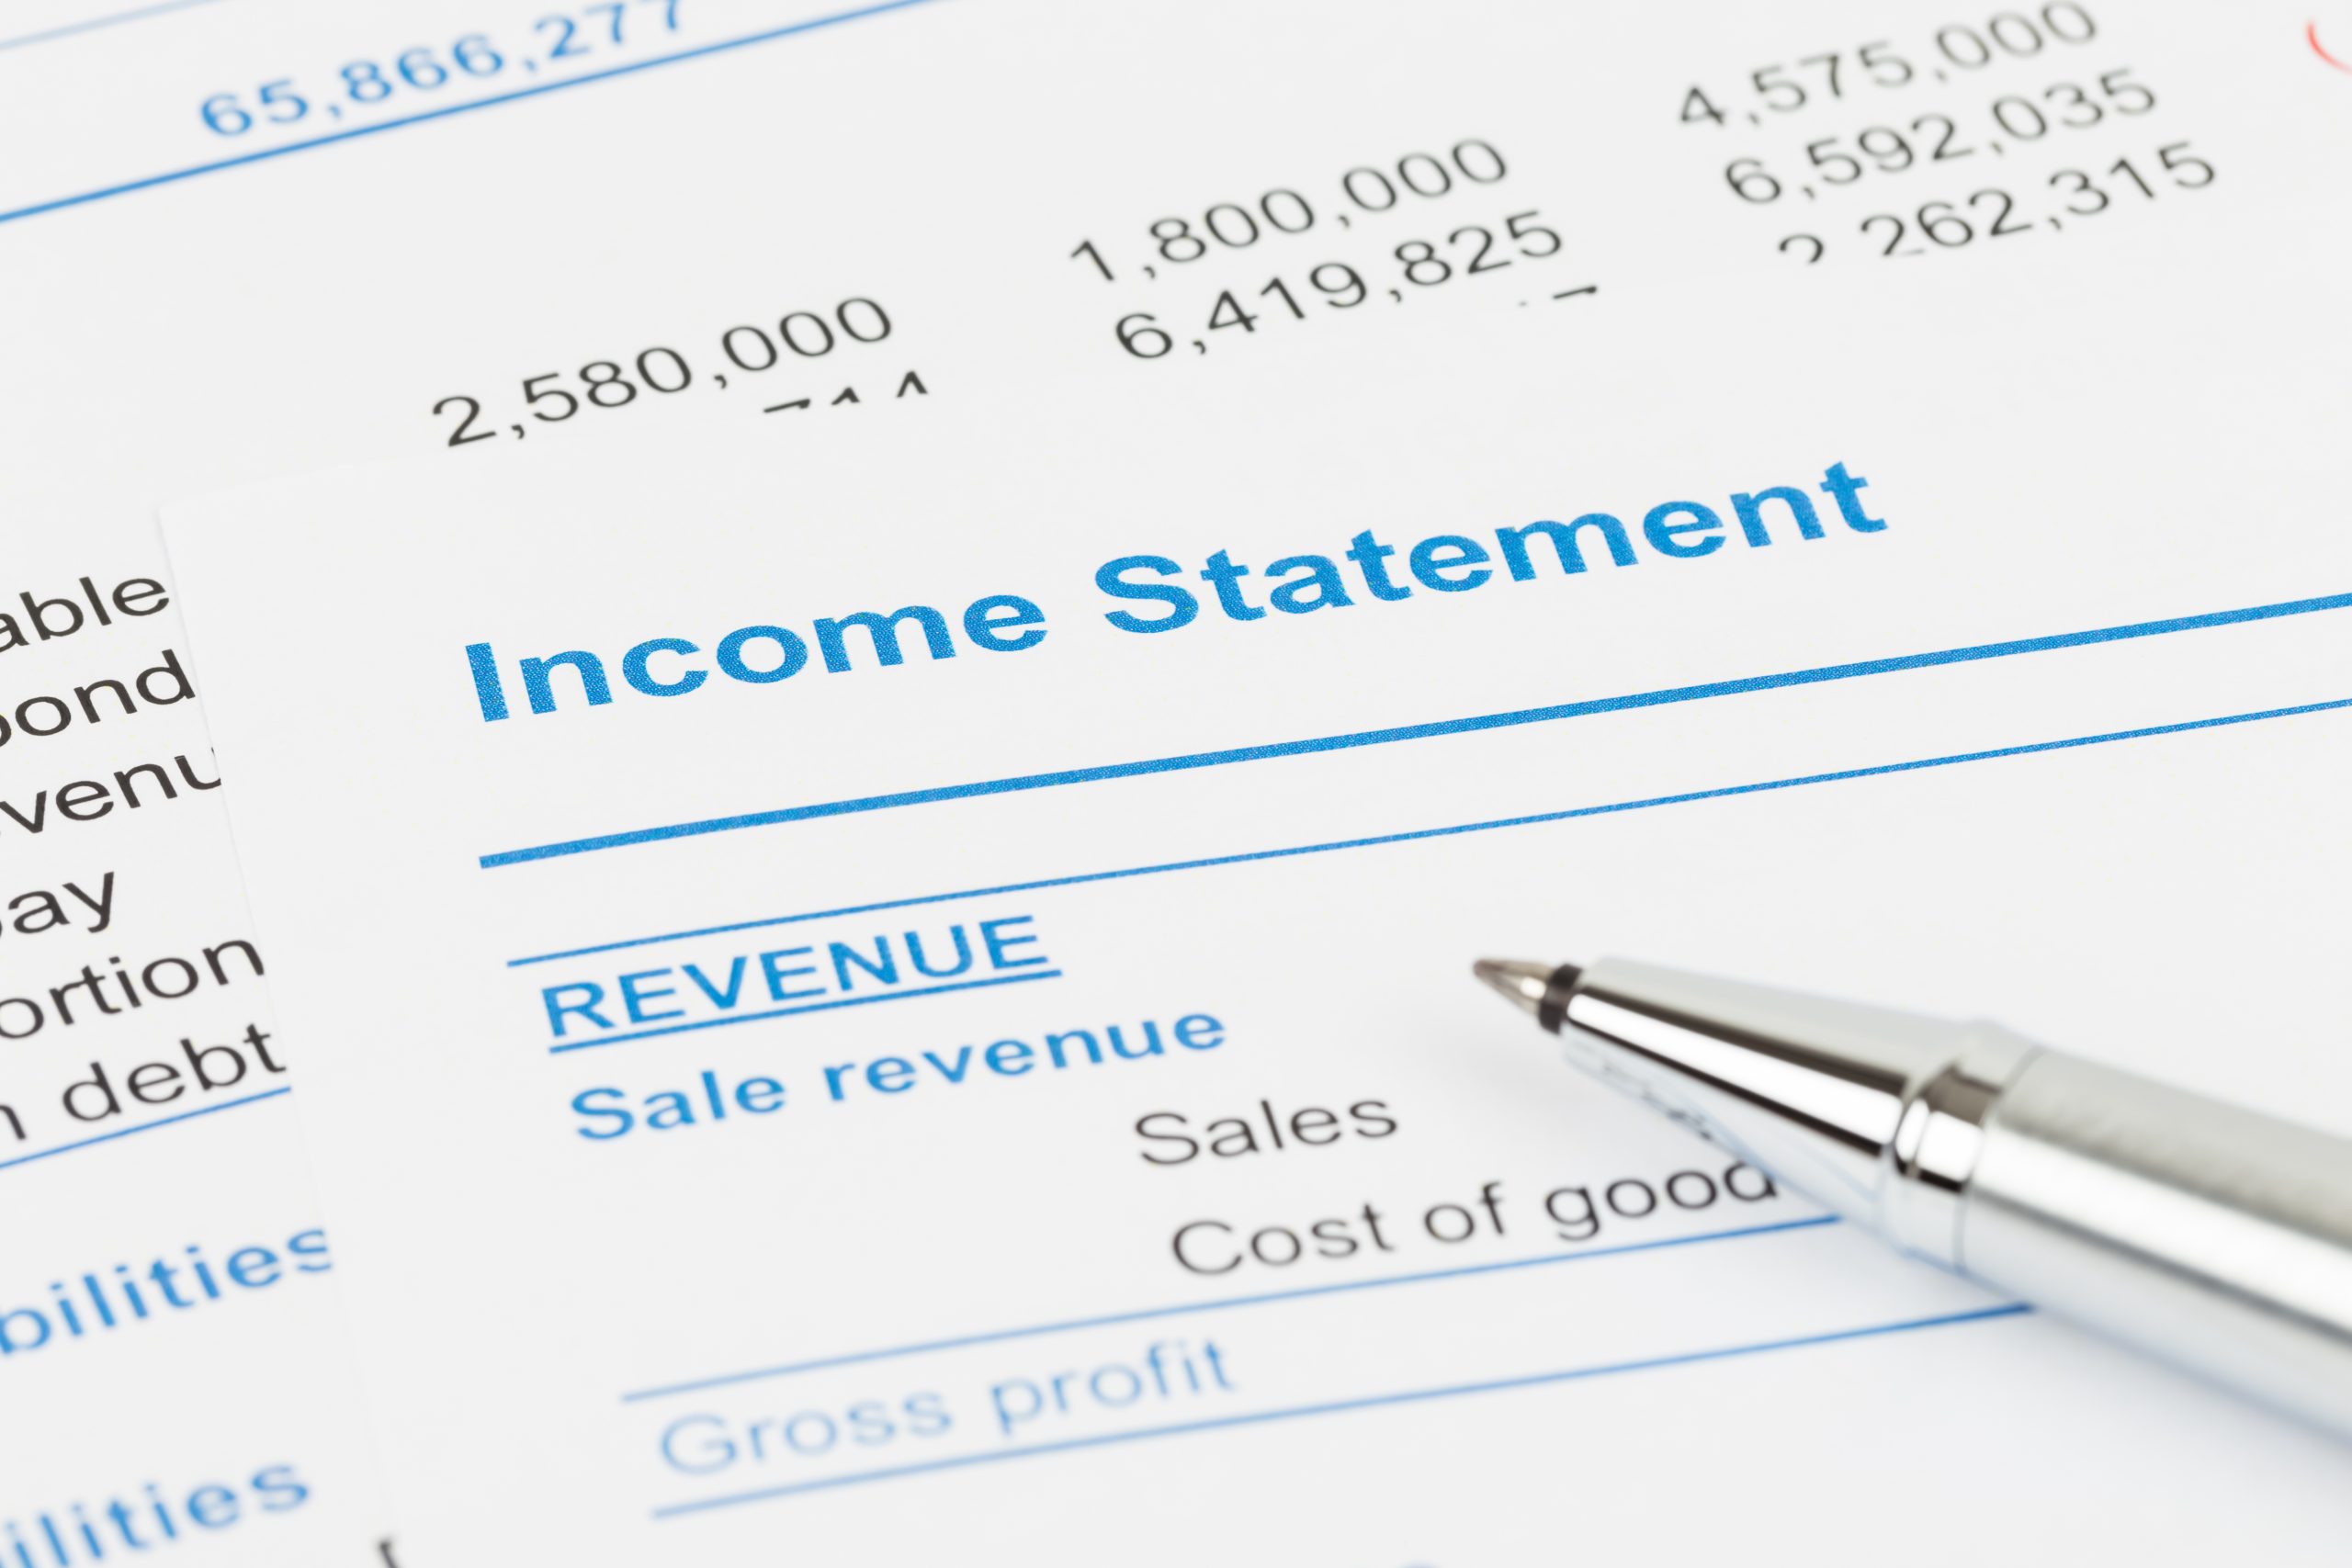
The standard return on assets calculation involves taking a company’s net income and dividing it by average total assets over a period. This ratio gets multiplied by 100 to convert into percentage terms. You need to know net income and average assets to calculate return on assets. You can find your net income, which is your business’s total profits after deducting business expenses. You can find net income at the bottom of your income statement. What is included in total assets? Bench Accounting lists examples of assets as total cash balance, accounts receivable, inventory, PP&E (property, plant, and equipment), investments, and intangible assets (like intellectual property).
Return On Assets = (Net Income / Average Total Assets) x 100
- Net income: Revenue minus cost of goods sold minus expenses
- Average total assets: The total assets on a company’s balance sheet at the end of the current year plus the total assets at the end of the previous year, divided by two
However, variations on the formula apply to specific sectors. For non-financial firms, leased assets require adjustment to estimate the assets’ fair value to include off-balance sheet. Comparing ROA appropriately considers industry-specific formula adaptations.
While mathematical differences exist across company types, ROA uniformly assesses profit generation relative to invested assets. Fine-tuning the formula centers the analysis on core drivers of return across different balance sheet mixes. As long as net income gets measured against the appropriate asset base, ROA offers an apples-to-apples metric of management’s capital allocation skills.
Return On Assets (ROA) Examples
The Business Insider article gives a good example using data from Nike’s balance sheets to figure its ROA for fiscal 2021:
- First, find Nike’s total assets at the end of fiscal 2021, which ended in May: $37.7 billion
- Next, find Nike’s total assets at the end of fiscal 2020: $31.3 billion
- Add those together and divide by two to get average assets: $34.5 billion
- Divide its 2021 net income ($5.7 billion) by average assets ($34.5 billion) and then multiply the result by 100, which gives you 16.5%
And when you plug the numbers into the formula, you get ROA = (5.7/34.5)*100 = 0.1652 or 16.5%
What Is Considered a Good ROA?
An ROA of 5% or better is considered pretty good, while 20% or better is considered outstanding. Generally, the higher the ROA, the more efficiently the company generates profits. However, any company’s ROA must be viewed in the context of its competitors in the same industry and sector. A Forbes article explains, “For example, an asset-heavy company, such as a manufacturer, may have an ROA of 6% while an asset-light company, such as a dating app, could have an ROA of 15%. If you only compared the two based on ROA, you’d probably decide the app was a better investment. A declining ROA may indicate a company might have made poor capital investment decisions and is not generating enough profit to justify the cost of purchasing those assets.
Conclusion
Your ROA percentage indicates how well your business manages its balance sheet to generate profits. While return on assets provides valuable insights, ROA alone doesn’t fully demonstrate organizational financial fitness. External dynamics like market shifts also sway results. Thus ROA should complement metrics like return on equity (ROE) or return on invested capital (ROIC) in assessing fiscal health.
Factoring income statement and balance sheet intricacies allows a robust interpretation. Testing different capital allocation strategies through DuPont analysis determines ROA drivers. Comparing competitor ROAs adds context. Examining cash flows and working capital paints a fuller picture. How does revenue convert into cash? How are assets funded?
ROA is best analyzed in aggregate to diagnose financial and operational factors influencing returns. Combined with other vital ratios and cash flow data, companies gauge areas to enhance capital productivity over the short and long term. Feel free to reach out to Huckabee CPA if you have any questions or if you like a free consultation.


