 According to Investopedia “financial analysis is the process of evaluating businesses, projects, budgets, and other finance-related transactions to determine their performance and suitability. Typically, financial analysis is used to analyze whether an entity is stable, solvent, liquid, or profitable enough to warrant a monetary investment.”
Financial statement analysis involves examining the numbers in a company’s financial reports (the P/L or Income statement, balance sheet, and cash flow statement) and using calculations to assess a company’s performance and make recommendations about how it can improve going forward. When it is done for a specific company, financial analysis can help founders or managers make future business decisions or review historical trends for past successes. Financial analysis can also help investors choose the best possible investment opportunities.
David Rodeck published an interesting article in the American Express business trends section that discusses 3 types of financial analysis ratio exercises or calculation frameworks that business owners can use to find patterns, gain insights, understand cash flow and demonstrate your company’s value to potential investors. The 3 financial analysis strategies include:
- DuPont Model ROE Formula Analysis
- Financial Ratio Analysis
- Common Size Analysis
1 DuPont Model ROE Formula Analysis
 (Image credit: management mania)
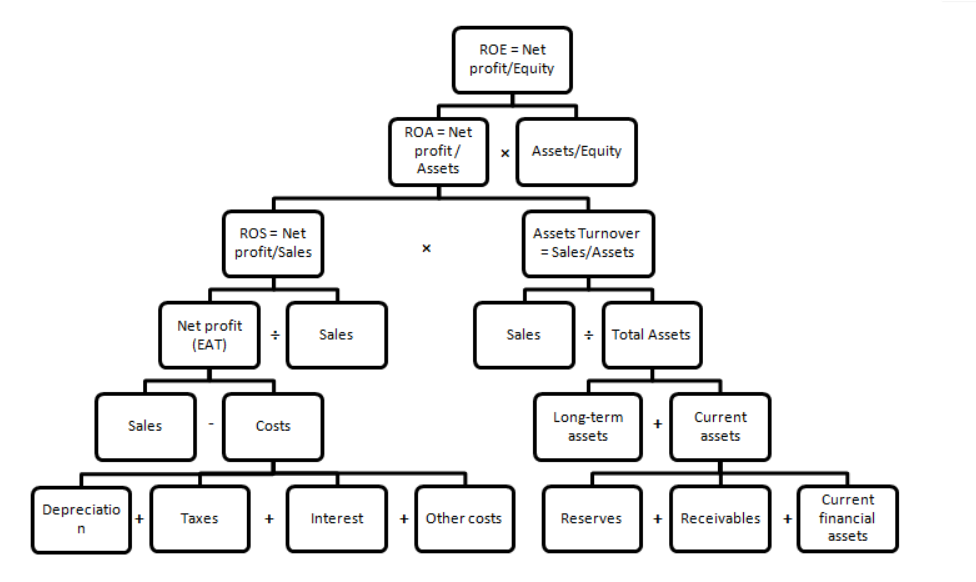
According to the Balance “The DuPont Model Return on Equity (ROE) Formula allows experienced investors to gain insight into the capital structure of a firm, the quality of the business, and the levers that are driving the return on invested capital—perhaps more so than with any other single metric.” The DuPont analysis is a way to measure the financial performance of a company and see what’s driving its return for the shareholders and business owners by breaking down ROE (that is, the returns that investors receive from a single dollar of equity) into three distinct ratio analysis elements. DuPont analysis is a framework that is now widely used to compare the operational efficiency of two similar firms.
According to Quartz, Back in 1919 Donaldson Brown, a finance executive at the DuPont Corporation in Wilmington, Delaware, first invented the DuPont formula (a return-on-investment framework) of financial analysis in an internal efficiency report.
The Balance article mentions that “the DuPont model is so valuable because it doesn’t just want to know what the return on equity is.” Instead, it explores the specific variables that are causing the ROE in the first place. By measuring and highlighting those underlying realities, it becomes easier to target them; develop corporate policies to improve or modify that which can be optimized; and take control through intelligent, purposeful, decisive action.
How Do You Calculate ROE?
By breaking the calculation into three parts, you can see what’s driving your business performance, whether it’s earning larger profits, selling inventory more quickly or taking on more debt.
There are three components in the calculation of ROE when doing a DuPont model analysis. Net Profit Margin x Asset Turnover x Equity Ratio, where…
- Net profit margin= Net Income / Revenue (Measures how much profitability the company makes out its revenue)
- Asset turnover = Sales / Average Total Assets (Measures your efficiency in using assets to make sales)
- The equity ratio / multiplier = Average Total Assets / Average Shareholder’s Equity (Measures your debt level relative to equity or how my much it is leveraged)
When Should a Business Owner use a Dupont Analysis
Ryan Maxwell, CPA and director of research at FirstRate Data told the American Express author “DuPont analysis is very useful for business owners to understand how to maximize the valuation of their business prior to selling or listing it via an IPO.”
If you are considering an exit strategy of selling your company that’s the time to focus on improving your DuPont analysis. As an example, if you can find a way to lower your company’s short-term expenses for the purpose of raising your profit margins or net income, to make your business look as as efficient as possible before deciding to sell it that would be useful. However the Amex article author explained that “boosting return by adding more debt is not as impressive for future buyers.”
It is possible for a company with terrible sales and margins to take on excessive debt and artificially increase its ROE. The equity multiplier, which is a measure of financial leverage, allows the investor to see what portion of the ROE is the result of debt.
The equity multiplier is calculated as follows:
Equity Multiplier = Assets ÷ Shareholders’ Equity
The Balance article explains that “this is not to say that debt is always bad. In fact, debt is an important part of optimizing the capital structure of a firm to generate the best trade-off between return on capital, growth, and trade-offs as it pertains to equity dilution.”
The asset turnover ratio is a measure of how effectively a company converts its assets into sales.
It is calculated as follows:
Asset Turnover = Revenue ÷ Assets
The asset turnover ratio tends to be inversely related to the net profit margin: The higher the net profit margin, the lower the asset turnover. The result is that an investor can compare companies using different models (low-profit, high-volume vs. high-profit, low-volume) and determine which business is more attractive.
The balance article also cites an example from the founder of Walmart, the late Sam Walton, often spoke about the insight that allowed him to build one of the largest fortunes in human history.
Mr Walton realized that he could make significantly more absolute profit by selling enormous volumes of merchandise at relatively lower profit margins over his existing asset base than he could by extracting huge profit margins on fewer individual sales. This allowed him to take market share from competitors and grow exponentially.
Walton was amazed that the people competing against him could see how rich he was getting, but they couldn’t bring themselves to switch to the discount model because they had become addicted to the idea of high profit margins, focusing on those margins instead of total profits.
The net profit margin is the after-tax profit a company generated for each dollar of revenue. Net profit margins vary across industries, making it important to compare a potential investment against its competitors. Although the general rule of thumb is that a higher net profit margin is preferable, it is not uncommon for management to purposely lower the net profit margin in a bid to attract higher sales.
There are two ways to calculate net profit margin:
Net Income ÷ Revenue
Net Income + Minority Interest + Tax-Adjusted Interest ÷ Revenue
Using this type of financial analysis is less helpful during times of recession or down markets. The Dupont formula is useful for finding ways to increase the future value of your business rather than helping it manage through a difficult stretch today. “It is not very useful for minimizing the risk of corporate failure as it focuses primarily on maximizing upside potential, “ said Mr Maxwell.
2 Financial Ratio Analysis
An article in Investopedia defines ratio analysis “as a quantitative method of gaining insight into a company’s liquidity, operational efficiency, and profitability by studying its financial statements such as the balance sheet and income statement.” Ratio analysis can mark how a company is performing over time, while comparing a company to another within the same industry or sector. Keep in mind that while ratios offer useful insights into a company, they should be combined with other financial metrics, to gain a better perspective into the financial health of a business.
Ratio analysis includes a wide range of different calculations which put the numbers on your financial statements in context. The American Express article gives an example “For example, if you hear a company has $10 million in debt, that might be excessive for a small business, but very manageable for a large corporation.” A ratio analysis could be used to calculate whether the debt load was appropriate, say by measuring total debt against total assets.
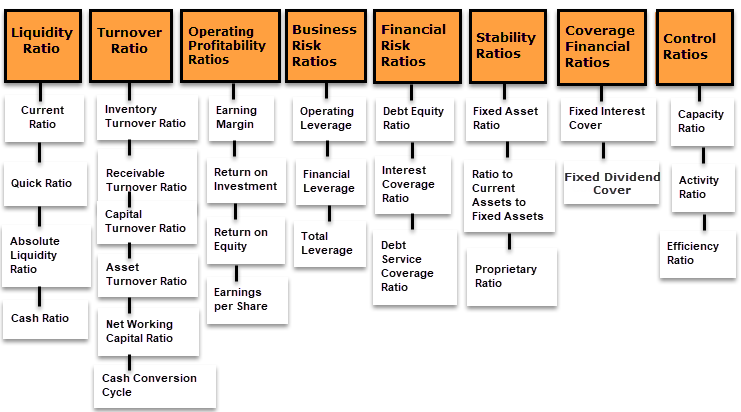
There are ratio calculations for profits, liquidity, operational efficiency, use of leverage, asset management and valuation, among other areas. This article in a site called Demonstrating Value has a complete list of financial ratios. Some examples of ratio analysis include:
- Gross Profit Ratio: Used to measure your profitability relative to your sales.
Gross Profit / Net Sales
- Quick Ratio: Used to see whether you are in position to safely cover your short-term debt with your liquid assets.
Short-Term Liquid Assets / Short-Term Liabilities
- Inventory Turnover Ratio: Used to see how quickly you’re selling goods and the demand for your products.
Cost of Goods Sold / Average Inventory Level
- Operating Expense Ratio: Compares expenses to revenue, a decreasing ratio is considered desirable since it generally indicates increased efficiency.
Operating Expenses / Total Revenue
- Cash Flow to Net Income Ratio: By using cash flow from operating activities as an objective measure it is possible to calculate cash flow ratios which supplement traditional ratios to give a better understanding of the performance and operation of a business.
Cash Flow From Operating Activities / Net Income
Once you calculate a ratio, you can compare them to snapshots of your business, as well as averages for your industry, which you can find on the web. The Amex article author points out that there are a number both free and paid resource tools that have industry benchmark and market intelligence data, some of the most popular include CSIMarket and Factiva.
When Should a Business Owner use a Ratio Analysis
Ratio analysis is a useful management tool that will improve your understanding of financial results and trends over time, and provide key indicators of organizational performance. Finance and accounting professionals often ratio analysis to pinpoint strengths and weaknesses from which strategies and initiatives can be formed. And during times of a recession or economic downturn the Amex article suggests that ratio analysis can help you see whether it’s only your business that’s having trouble or whether it’s an industry-wide problem by comparing against industry benchmark averages. Running through these formula calculations may also help you uncover issues you weren’t totally aware of. Jim Pendergast, a SVP of altLINE, the alternative lending arm of The Southern Bank Company which provides invoice and A/R factoring lending products stated “during turbulent social and economic times, these ratios might help inspire some creative problem solving or process innovations helping you stay out of the red.”
For example, if your company’s inventory turnover for a certain product is increasing, you may need to rethink your sales approach or whether the product is worth keeping.
Ryan Maxwell, a CPA and director of research at FirstRate Data, suggests using cash-flow statement ratios, such as the cash flow to net income ratio (cash flow from operating activities/net income) to dive a little deeper.
“This ratio shows the proportion of a company’s profits that are actually cash profits as opposed to ‘accounting profits.’ Business owners often focus on profitability numbers such as net income without noticing there are serious cash-flow issues developing.” stated Mr Maxwell.
Cash flow management is important for companies of all sizes but especially for startups and small businesses, a 2019 QuickBooks Cash Flow Survey of 3,500 companies with 0-100 employees revealed that 44% of small business owners who experienced cash flow issues say the problems were a surprise. Running out of cash is the 2nd biggest reason that startups fail.
3 Common Size Analysis
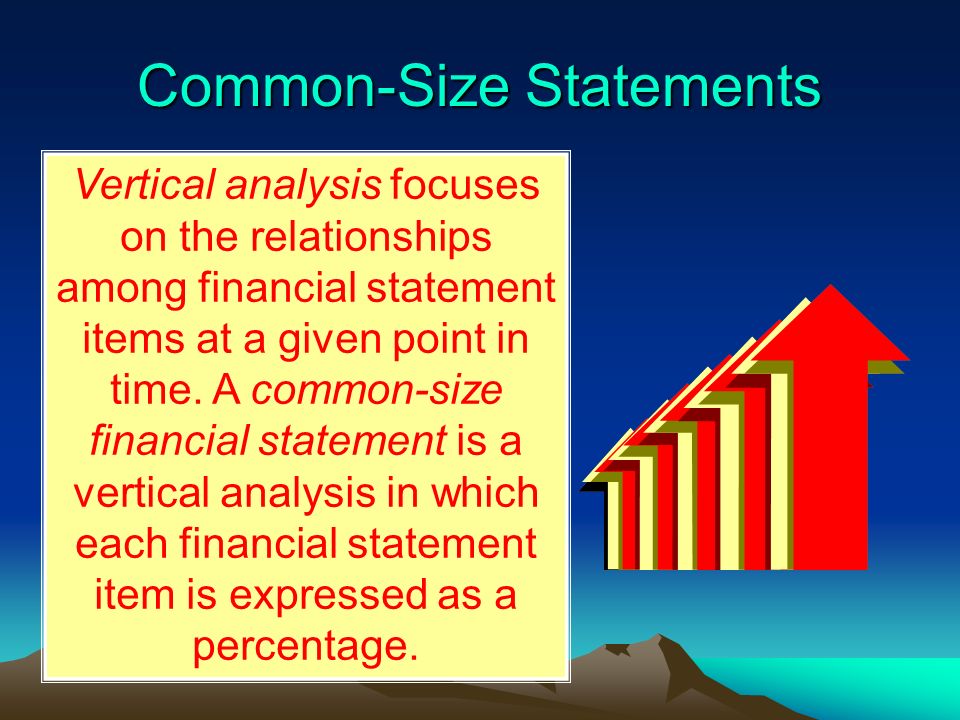
Common size analysis, also sometimes referred to as vertical analysis, is a tool that financial managers use to analyze financial statements. It evaluates financial statements by expressing each line item as a percentage of the base amount for that period. The analysis helps to understand the impact of each item in the financial statement and its contribution to the resulting figure.
An article in the Corporate Financial Institute states that The technique can be used to analyze the three primary financial statements, i.e., balance sheet, income statement, and cash flow statement. In the balance sheet, the common base item to which other line items are expressed is total assets, while in the income statement, it is total revenues.
Common size financial statement analysis is computed using the following formula:
Percentage of base = amount of individual item/amount of base item x 100
So when using the common size analysis, you take the information from your financial statements and recalculate as a percentage of a base amount. The Amex article author cited an example, on an income statement (which shows a company’s profit/loss), you would recalculate each part as a percentage of your total revenue for the period. Here’s an example:
|
Income Statement |
Common Size Analysis | |
| Sales | $500,000 | 100% |
| Cost of Goods Sold | $300,000 | 60% |
| Gross Profit | $200,000 | 40% |
| Selling and Operating Expenses | $25,000 | 5% |
| General and Admin Expenses | $25,000 | 5% |
| Pre-Tax Operating Profit | $150,000 | 30% |
In this table graph example you will see everything was a percentage of the total sales such as Gross Profit = $200,000/$500,000 = 40%.
When Should a Business Owner use a Common Size Analysis
The Common Size Analysis ratio can be a useful financial management tool to use in times when your revenue suddenly drops, such as during a recession. Whereas you can see numbers going up and down on your statements, common size analysis actually measures the percentage shifts in those numbers.
So say for example, that next period your cost of goods sold suddenly jumps from 60% to 70%. That shows you’re paying more for your inventory and you may need to renegotiate with suppliers. You could more easily catch that using the common size analysis.
In the Amex article, a former CPA, Zach Reece, now the owner of Colony Roofers explained that “a common size financial statement is the best to use during the COVID situation.” He further elaborated “In this method, all factors are represented as a percentage of the same base figure. Thus, when the market is down, this is the best way to see how your company is doing compared to last year.”
The Common Size Analysis method is not as detailed as financial analysis using ratios. An article by the Balance states that “It does not provide enough data for some sophisticated investment decisions. For small business managers who have insufficient or no formal education in financial management, the Common Size Analysis provides a simple way to analyze their financial statements.”
Conclusion
So these are a few different financial analysis methods or formulas used by analysts, corporate finance managers and accounting professionals that can give small business owners better insights into the financial health of their company.
By using some of the financial analysis strategies an owner should be able to forecast finances and uncover more insight out of your statements while giving yourself ideas on how to navigate tough times. Financial analysis is a set of activities including planning, budgeting and forecasting that support financial management and improve decision-making for companies. Feel free to reach out to Huckabee CPA if you have any questions or if you like a free consultation.